General outlier detection for univariate datasets
Source:vignettes/generaloutlier.Rmd
generaloutlier.RmdIntroduction to general data outlier detection
- Two approaches are supported, namely 1) setting only one variable of interest and 2) setting multiple variables of interest.
Setting one variable of interest
We used the iris dataset, which is embedded in the datasets package which is always preinstalled in R.
The presence of outliers is a general concern even is data which is not specifically for species distribution modelling. Also, the same approach of adhoc selection of outlier detection method is considered to detect and remove outliers in the data, which increased subjectivity. Therefore, we extend specleanr principle of ensembling multiple outlier detection methods to identify absolute outliers in the datasets which can later be removed.
The same process is followed but the no data extraction and evaluating model performance is required.
1. Preparing data
- To enable identify and extract outliers, we introduced noticeable outliers in iris dataset. This is done exclusively for instructional purposes only.
irisdata1 <- iris

#introduce outlier data and NAs

rowsOutNA1 <- data.frame(x= c(344, NA,NA, NA),
                         x2 = c(34, 45, 544, NA),
                         x3= c(584, 5, 554, NA),
                         x4 = c(575, 4554,474, NA),
                         x5 =c('setosa', 'setosa', 'setosa', "setosa"))

colnames(rowsOutNA1) <- colnames(irisdata1)


dfinal <- rbind(irisdata1, rowsOutNA1)
Detecting outlier in changed iris dataset
We can only use univariate methods to detect only in in variable such
as Sepal.Length or we can exclude the species column and also use
multivariate methods such as isolation forest, Mahalanobis outlier
detection method or One class support vector machines. To identify the
methods allowed in this package, run
extractMethod()
NOTE * Because we are considering univariate analysis, the parameter sdm is set to FALSE.
Also, all multivariate outlier detection methods are not necessary for univariate datasets. The function extractMethods() can be used to identify the different methods allowed.
Indicate na.inform to show how NAs are handled in the dataset. If percentage NAs in a column are greater than then missingness parameter, then that particular column will be removed. Otherwise, the rows with NAs will be removed using na.omit to avoid failing the outlier detection methods. In summary, increasing missingness may lead to loss many rows especially if any column has more missing values.
2. Filter out only setosa data before outlier detection
setosadf <- dfinal[dfinal$Species%in%"setosa",c("Sepal.Width", 'Species')]

setosa_outlier_detection <- multidetect(data = setosadf,
                                var = 'Sepal.Width',
                                multiple = FALSE,
                                methods = c("adjbox", "iqr", "hampel","jknife",
                                            "seqfences", "mixediqr",
                                            "distboxplot", "semiqr",
                                            "zscore", "logboxplot", "medianrule"),
                       silence_true_errors = FALSE,
                       missingness = 0.1,
                       sdm = FALSE,
                       na.inform = TRUE)
#> 1 (1.85%) NAs removed for parameter Sepal.Width.

#extractMethods()
3. Visualize the number of outliers detected by each method
ggoutliers(setosa_outlier_detection)
4 Obtaining quality controlled dataset using loess method or data labeling
setosa_qc_loess <- extract_clean_data(refdata = setosadf,
                                      outliers = setosa_outlier_detection, loess = TRUE)

#clean dataset
nrow(setosa_qc_loess)
#> [1] 51

#reference data
nrow(setosadf)
#> [1] 54

setosa_qc_labeled <- classify_data(refdata = setosadf, outliers = setosa_outlier_detection)
5 Visualize labelled quality controlled dataset
ggenvironmentalspace(setosa_qc_labeled,
                     type = '1D',
                     ggxangle = 45,
                     scalecolor = 'viridis',
                     xhjust = 1,
                     legend_position = 'blank',
                     ylab = "Number of records",
                     xlab = "Outlier labels")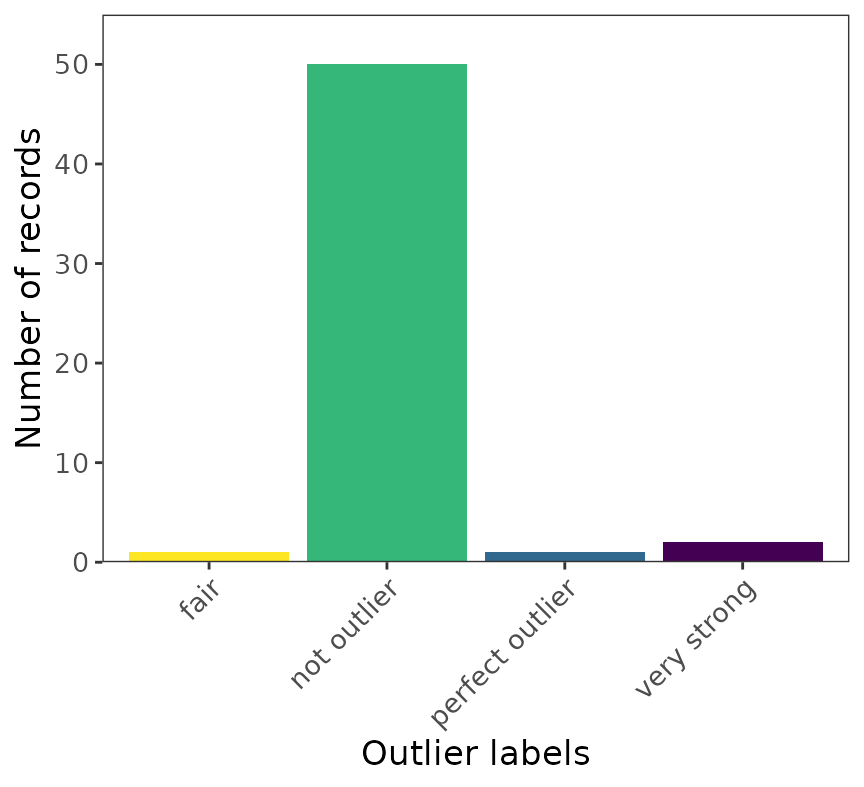
For multiple species but using only variable of interest
NOTE
- For multiple groups, the parameter multiple is changed to TRUE and the var_col should be provided as demonstrated below.
6. Outlier detection across the species groups in iris dataset
multspp_outlier_detection <- multidetect(data = dfinal,
                                var = 'Sepal.Width',
                                multiple = TRUE,
                                var_col = "Species",
                                methods = c("adjbox", "iqr", "hampel","jknife",
                                            "seqfences", "mixediqr",
                                            "distboxplot", "semiqr",
                                            "zscore", "logboxplot", "medianrule"),
                       silence_true_errors = FALSE,
                       missingness = 0.1,
                       sdm = FALSE,
                       na.inform = TRUE)
#> 1 (1.85%) NAs removed for parameter Sepal.Width.
#> 0 (0%) NAs removed for parameter Sepal.Width.
#> 0 (0%) NAs removed for parameter Sepal.Width.
7 Visualise the number of outliers detected by each method
ggoutliers(multspp_outlier_detection)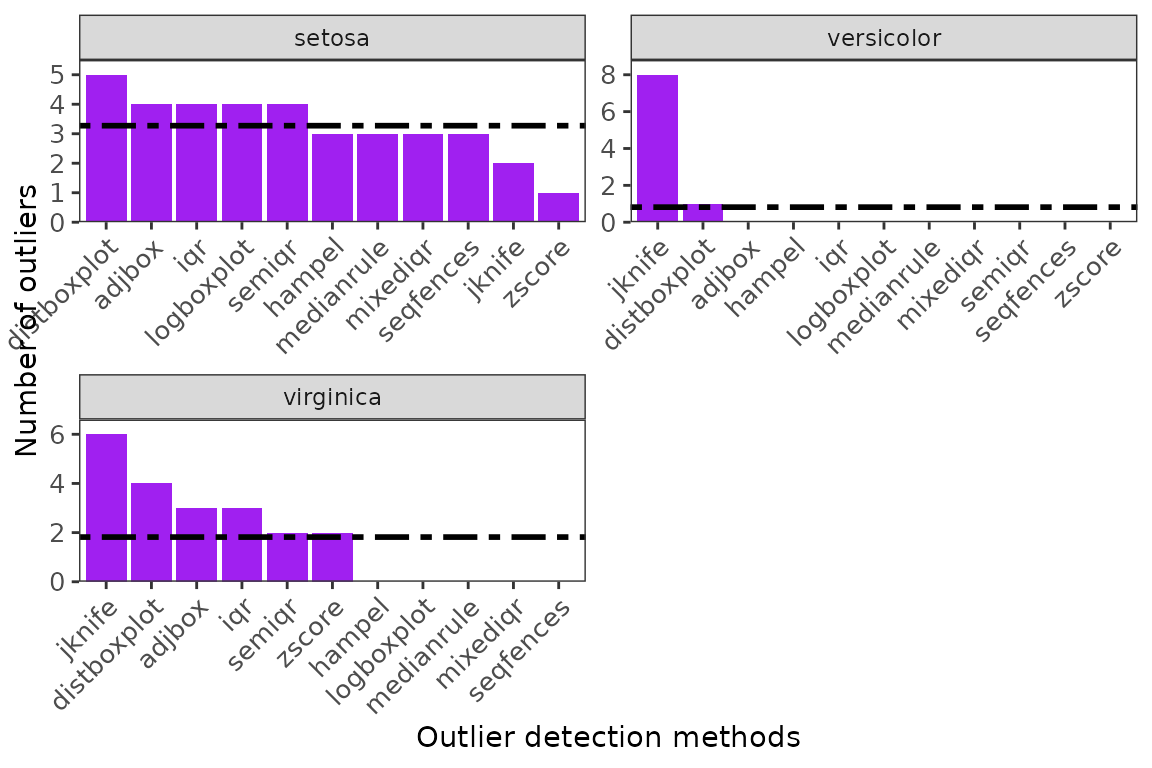
8 Obtaining quality controlled dataset using loess method or data labeling
multsp_qc_loess <- extract_clean_data(refdata = dfinal,
                                      outliers = multspp_outlier_detection,
                                      var_col = 'Species',
                                      loess = TRUE)

#clean dataset
nrow(multsp_qc_loess)
#> [1] 151

#reference data
nrow(dfinal)
#> [1] 154

multi_qc_labeled <- classify_data(refdata = dfinal,
                                      outliers = multspp_outlier_detection,
                                  var_col = 'Species')
10 Visualise labelled quality controlled dataset
ggenvironmentalspace(multi_qc_labeled,
                     type = '1D',
                     ggxangle = 45,
                     scalecolor = 'viridis',
                     xhjust = 1,
                     legend_position = 'blank',
                     ylab = "Number of records",
                     xlab = "Outlier labels")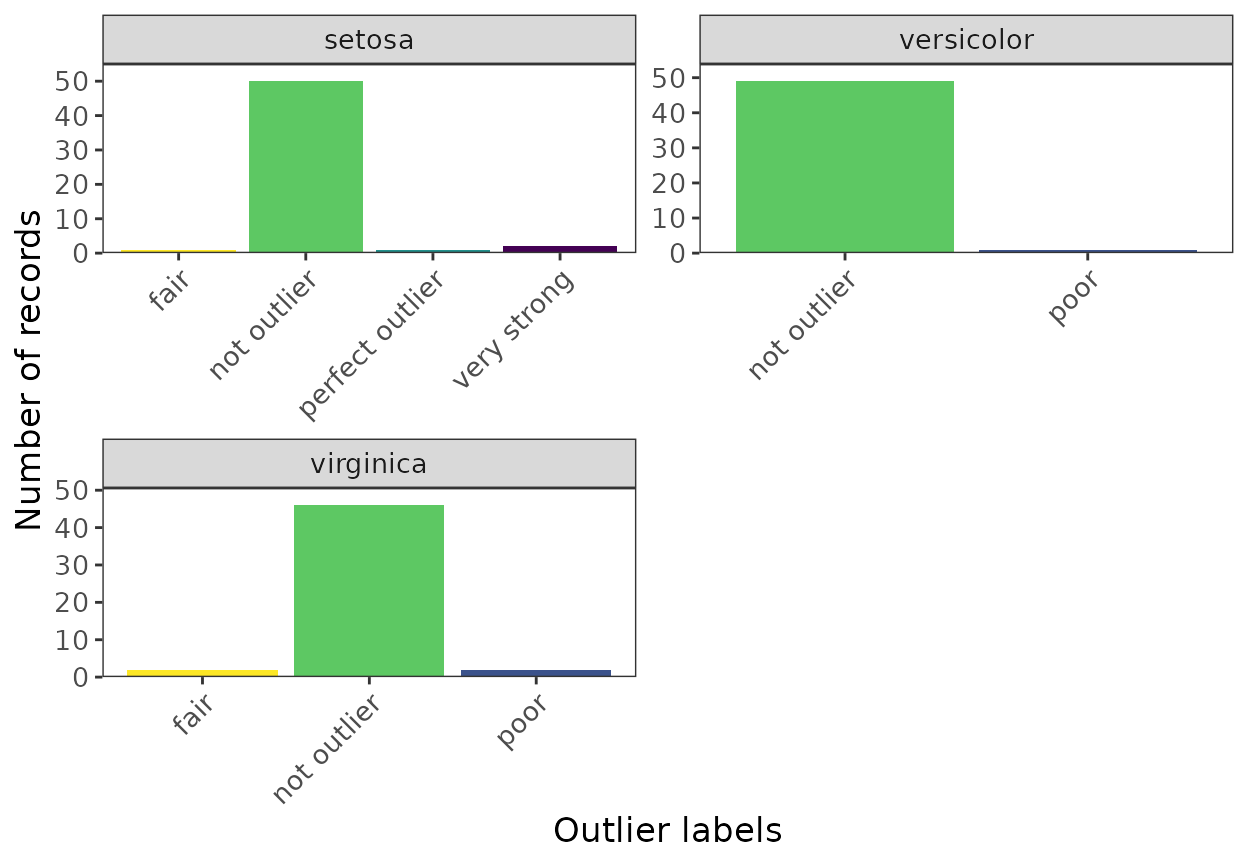
The second approach is setting multiple variables of interest
- We used the same dataset but now indicating multiple variables of interest, e.g., Sepal.Length and Sepal.Width
11. Outlier detection
multivariables <- multidetect(data = dfinal, multiple = TRUE,
                      var = c('Sepal.Length', 'Sepal.Width'), output = 'outlier',
                      var_col = 'Species',
                      methods = c('zscore', 'adjbox',
                                  'logboxplot', 'distboxplot',
                                  'iqr', 'semiqr','seqfences','hampel',
                                  'jknife'),
                      warn = FALSE,
                      sdm = FALSE)
12. Visualize the number of outliers detected by each method
ggoutliers(multivariables)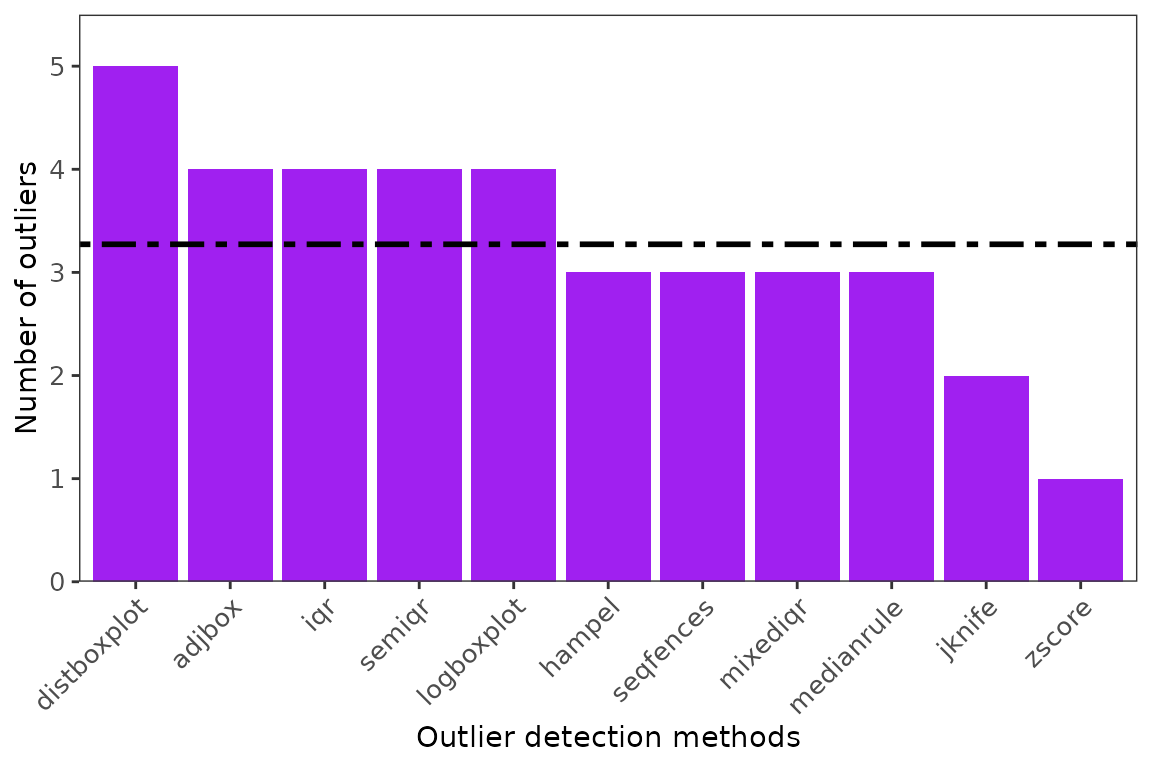
13. Data extraction
- During data extraction, two approaches exist: setting the outliers to NA or returning already quality-controlled data for the variable of interest.
NOTE
- For this approach, only threshold setting is allowed. Data classification will be implemented in the upcoming package versions using the LOESS method.
- Only univariate methods are allowed, and the variable is handled exclusively from the other. This means outlier detection is implemented in only the variable set during outlier detection in Step 12.
#outliers will be returned to NA for each variable

lenwidth_clean <- extract_clean_data(dfinal, outliers = multivariables,
                                     var_col = 'Species', outlier_to_NA = TRUE, threshold = 0.8)
nrow(lenwidth_clean)
#> [1] 154

lenwidth_long <- extract_clean_data(dfinal, outliers = multivariables,
                                     var_col = 'Species', outlier_to_NA = FALSE, threshold = 0.8)
nrow(lenwidth_long)
#> [1] 305
The package is undergoing peer review for publication