specleanr The package aims to improve the reliability and acceptability of biogeographical models, including species distribution models, ecological niche models, and bioclimatic envelope models, by detecting outliers in the environmental predictors. In the package, we collate 20 outlier detection methods, which a user can collectively apply (ensemble outlier detection) and determine whether the species records are in a suitable environmental space. The package complements other packages that address geographical, taxonomic, and temporal checks.
Installation
# install.packages("remotes")

#remotes::install_github("AnthonyBasooma/specleanr")
Process of identifying environmental outliers.
The process of identifying environmental outliers is generally classified into four steps as detailed below (Figure 1);
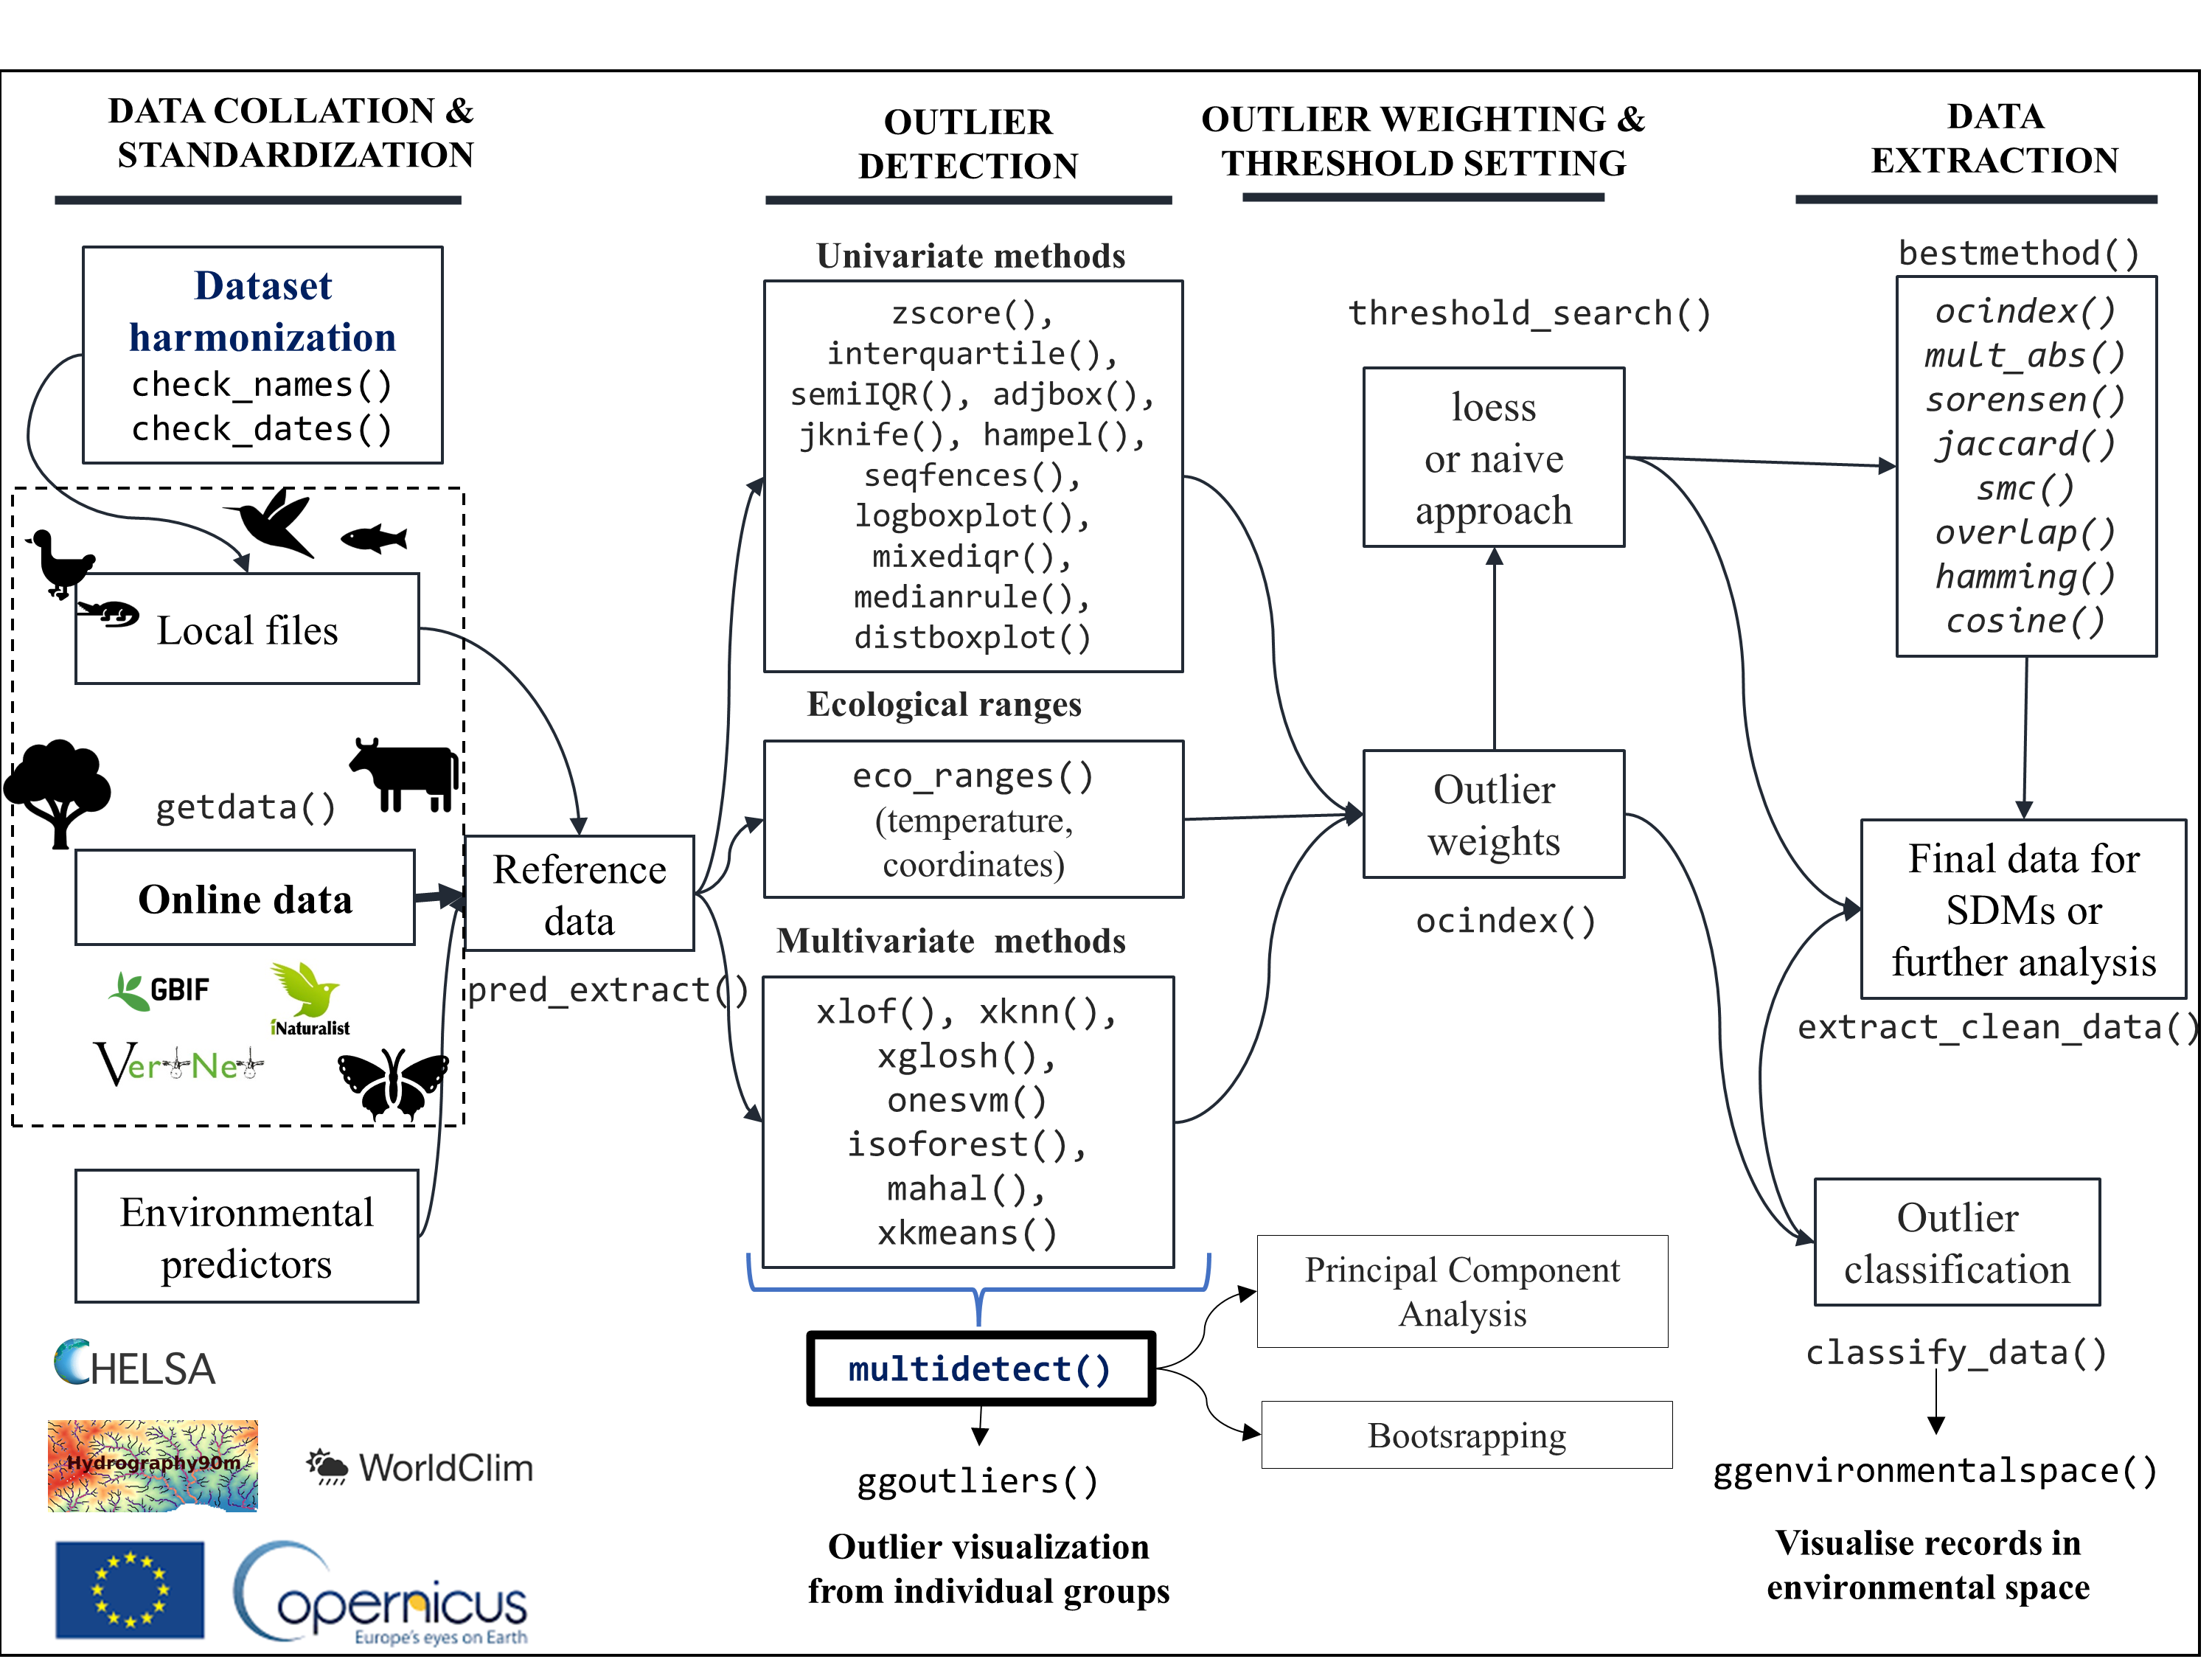
- Arranging of species records and environmental data.
This includes collecting species data from either online sources or locally stored data. The user can check for species records for geographical, taxonomic, or temporal inconsistencies such as missing coordinates, interchanged coordinates, species name spelling mistakes, and wrong event dates. Environmental data, mainly in the raster format, is based chiefly on user needs, but numerous sources include WORLDCLIM (Fick & Hijmans, 2017) and CHELSA (Karger et al., 2017) for bioclimatic variables; Hydrography90m for stream or river-based hydromorphological parameters such as stream order, flow accumulation, stream power index, and stream transportation index (Amatulli et al., 2022); and Copernicus for land use changes. A comprehensive database for environmental predictors can be accessed at https://hydrography.org/environment90m/environment90m_layers.
- Extracting the environmental predictors.
The environmental predictors are extracted from points where the species was recorded present or absent. The extracted dataset forms the species reference dataset for environmental outlier checks. In the package we included pred_extract() to extract the environmental predictors.
- Ensemble multiple methods for outlier detection.
Multiple outlier detection methods are used; each method flags outliers in the same dataset. These outliers are then compared among methods to determine records, which are flagged by several methods called absolute outliers or true outliers. The total number of methods that a user can ensemble is user-based; however, we expect the user to set at least three outlier detection methods. The methods should be also at least from different categories, which include 1) univariate methods, 2) multivariate methods, and 3) ecological ranges. The must set all the methods using multidetect() function and not individual method functions to allow seamless comparison.
Univariate methods
These methods only detect outliers in one environmental predictor. It is strongly advisable that the user selects an environmental predictor which directly affects the species distribution, for example, minimum temperature of the coldest month (IUCN 2012; Logez et al., 2012).
| Function | Method implemented | Userword in multidetect()
|
|---|---|---|
zscore() |
Z-score | zscore |
semiIQR() |
Semi interquartile range | semiqr |
adjustboxplots() |
Adjusted boxplot-robust boxplot method | adjbox |
interquartile() |
Interquartile range (IQR) | iqr |
medianrule() |
Median rule method | medianrule |
logboxplot() |
Logarithmic boxplot | logboxplot |
seqfences() |
Sequential fences | seqfences |
mixediqr() |
Mixed semi and interquartile range | mixediqr |
distboxplot() |
distribution-based boxplots | distboxplot |
rjknife() |
Reverse jackknifing | jknife |
hampel() |
The Hampel filter method | hampel |
Multivariate methods
These methods detect outliers in multiple environmental predictors (multidimensional space). User should exclude unnecessary columns such as the coordinates such that they are not included in the computation.
| Function | Method used to fit and detect outliers | Userword in multidetect()
|
|---|---|---|
isoforest() |
Isolation forest | iforest |
onesvm() |
One-class support vector machine | onvesvm |
xglosh() |
Global-Local Outlier Score from Hierarchies. | glosh |
xknn() |
k-nearest neighbor | knn |
xlof() |
Local outlier factor | lof |
xkmeans() |
k-means clustering | kmeans |
xkmedoids() |
Partitioning around the kmedoids | kmedoid |
mahal() |
Mahalanobis distances both robust and simple | mahal |
Ecological ranges
The user collates the species optimal ecological ranges to identify the species records outside the known optimal ranges. In the package, for a single species, the optimal ranges (minimum, maximum, or mean values) are provided manually, and the user is required to set the environmental predictor to be used for flagging the outliers. A dataset with the minimum and maximum values (optimal ranges) is allowed for multiple species. Note If the taxa is fish, we included the thermal_ranges() and geo_ranges() functions, which a user can set to flag records exceeding the FishBase collated temperature and latitudinal/longitudinal ranges. The user word optimal must be used in the multidetect() function for seamless comparisons with other methods.
- Extract species environmental without outliers
Threshold identification
After outlier removal, the threshold to classify a record as an absolute outlier that necessitates the user to do so objectively is pivotal in this workflow. Therefore, we have developed three options for obtaining a threshold. A threshold is the proportion of methods that flagged a record as an outlier to the total number of techniques used. For example, if a user includes ten methods and sets a threshold of 0.7, it implies that an absolute outlier will be flagged in at least seven methods. In this package, we developed three ways to identify the optimal threshold.
Naive method: where the user sets a value between 0.1 and 1. The process is subjective, but using this method, it is advisable to use a threshold beyond 0.6 to highlight records flagged in at least 50% of the methods.
loess method: we apply local regression (locally estimated/weighted scatterplot smoothing) to identify the optimal threshold, a non-parametric smoothing method that uses local variability in the data (Cleveland & Loader, 1996; Loader, 2004).
The reference dataset in Step 2 and lists or outliers flagged by each method in Step 3 are then used to retain the clean dataset. Under the hood, two approaches are implemented 1) absolute method: where absolute outliers are removed at a particular threshold or 2) suitable or best outlier detection method where a method with highest proportion of absolute outliers and has highest similarity with other methods (in terms of the outliers flagged) can be used.
-
extract_clean_data()to extract clean data using the reference data and outliers for single species.
- Post-environmental outlier removal
-
ggoutliers()to visualize the outliers flagged by each method. If multiple species are considered, then the index or species name should be provided.After environmental outlier removal, the user can examine the improvement in the model performance before and after environmental outlier removal. The following function can be used.
Package website To access the details of this package, please check it website on specleanr
Package citation
Basooma, A., Schmidt-Kloiber, A., Domisch, S., Torres-Cambas, Y., Smederevac-Lalić, M., Bremerich, V., Meulenbroek, P., Tschikof, M., Funk, A., Hein, T. and Borgwardt, F. 2025. ‘specleanr’: an R package for automated flagging of environmental outliers in ecological data for modeling workflows. Ecography 2025: e08221 (ver. 1.0).
References
Amatulli, G., Garcia Marquez, J., Sethi, T., Kiesel, J., Grigoropoulou, A., Üblacker, M. M., Shen, L. Q., & Domisch, S. (2022). Hydrography90m: A new high-resolution global hydrographic dataset. Earth System Science Data, 14(10), 4525–4550. https://doi.org/10.5194/essd-14-4525-2022
Cleveland, W. S., & Loader, C. (1996). Smoothing by local regression: Principles and methods. In Statistical Theory and Computational Aspects of Smoothing: Proceedings of the COMPSTAT’94 Satellite Meeting Held in Semmering, Austria, 27-28, 10–49.
Fick, S. E., & Hijmans, R. J. (2017). WorldClim 2: new 1-km spatial resolution climate surfaces for global land areas. International Journal of Climatology, 37(12), 4302–4315. https://doi.org/10.1002/joc.5086
Karger, D. N., Conrad, O., Böhner, J., Kawohl, T., Kreft, H., Soria-Auza, R. W., Zimmermann, N. E., Linder, H. P., & Kessler, M. (2017). Climatologies at high resolution for the earth’s land surface areas. Scientific Data, 4. https://doi.org/10.1038/sdata.2017.122
Loader, C. (2004). Smoothing: local regression techniques. Handbook of Computational Statistics: Concepts and Methods, Art. 12.
Logez, M., Belliard, J., Melcher, A., Kremser, H., Pletterbauer, F., Schmutz, S., Gorges, G., Delaigue, O., & Pont, D. (2012). Deliverable D5.1-3: BQEs sensitivity to global/climate change in European rivers: implications for reference conditions and pressure-impact-recovery chains.
IUCN Standards and Petitions Committee. (2022). THE IUCN RED LIST OF THREATENED SPECIESTM Guidelines for Using the IUCN Red List Categories and Criteria Prepared by the Standards and Petitions Committee of the IUCN Species Survival Commission. https://cmsdocs.s3.amazonaws.com/RedListGuidelines.pdf.